Do you dream about visualising PROV’s Archival Control Model and the holdings in engaging and innovative ways that seemlessly show the inter-relationships between Function, Agency, Series, Consignment, Unit and Item? Do you wake up each morning punching the air with the very thought of embedding within this visualisation a way of navigating through the records?
No…neither do we. But we want to!
Team PROV (Asa and Sebastian) are coming to THATcamp armed with XML files containing a sample of the records and their relationships to each other. We are hoping that some of the more artistically/technically minded among you may support us in our quest to develop a ‘better way into the records’ and a ‘new way of seeing the holdings’. At a very basic level this may mean:
“1. a timeline of agencies
2. a map of function/ agency relationships (ie functions with agencies clustered around them)
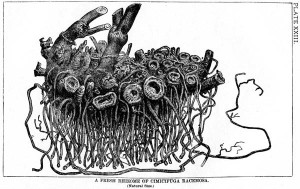
3. a ‘rhizome’ of agencies
Even if we only get a static or partial visualisation, it’s still something to build on…” (suggested by some PROV staff)
